


A traditional DWH stores structured, processed data optimized for SQL queries. A Data Lake stores raw data in any format (structured, semi-structured, unstructured) cheaply but without query optimization. A Lakehouse combines both. It stores raw files in open formats (Parquet, Delta) on cheap object storage, but adds a metadata and transaction layer (Delta Lake, Apache Iceberg) that enables full SQL query performance, ACID transactions, and schema enforcement on top.
Why data warehouses fail and how to design one that doesn’t

 23 minutes read
Content
Every company today calls itself data driven. But there’s a big gap between having data and being able to use it. Reports that take hours to run, dashboards that show different numbers depending on who built them, and analysts spending most of their time cleaning data instead of analyzing it. These are data warehouse design problems.
A data warehouse is the foundation that determines whether an organization can actually act on its data. Get it right, and every new dataset you ingest, every new team you onboard, and every new question you need to answer makes the whole system more valuable. Get it wrong, and you spend years paying down technical debt while your competitors enjoy their growth and development. This article aims to ensure you never get it wrong.


Struggling with slow reports and conflicting numbers?
Let’s audit your data architecture.
The core of data-driven enterprises
What is a data warehouse?
A Data Warehouse (DWH) is a centralized, subject-oriented repository designed exclusively for analytical reporting and decision-making. It’s not for running day-to-day operations. The term was formalized by Bill Inmon in 1990, and his five defining characteristics still hold up today: subject-oriented, integrated, time-variant, non-volatile, and designed for analytical access.
Subject-oriented means the warehouse is organized around business concepts (customers, products, sales) rather than around the applications that generate the data. Integrated means data from dozens of source systems, each with its own naming conventions and quirks, is reconciled into a single consistent model. Time-variant means the warehouse stores history: not just what the data looks like now, but what it looked like at every point in the past. Non-volatile means once data lands in the warehouse it is not updated or deleted in the traditional sense. The “designed for analytical access” part is self-explanatory.
Modern DWHs add another critical characteristic: columnar storage. Rather than storing rows together on disk, they store each column together. A query that needs only three columns out of fifty reads only those three columns, dramatically reducing I/O for analytical workloads that aggregate across millions of rows.
OLTP vs. OLAP: Definitions and differences
These two paradigms represent fundamentally different optimization targets, and understanding the gap between them is the foundation of everything in DWH design.
OLTP (Online Transaction Processing) systems power day-to-day operations. When you tap your card at a payment terminal, an OLTP database writes a row, updates a balance, and confirms the transaction in milliseconds. These systems are normalized to minimize redundancy, use row-based storage for fast single-row lookups, and handle thousands of concurrent short-lived write operations. Correctness and consistency are the top priorities.
OLAP (Online Analytical Processing) systems are designed for the opposite workload: large, complex, read-heavy queries that aggregate across millions or billions of rows. If you need to calculate total sales by product category and region, broken down by quarter, for each of the last three years, that is an OLAP query. It touches enormous volumes of data, reads only the needed columns, and returns a small summary.
One of the most common and costly mistakes organizations can make is running analytical queries directly against an OLTP system. It damages production performance, produces inconsistent results (data changes while the query runs), and hits hard limits as data volumes grow.
What are the business cases?
The business case for a DWH addresses several distinct organizational pain points simultaneously.
The most politically charged driver is the elimination of the “multiple versions of the truth” problem. Without a DWH, the sales, finance, and operations teams each pull data from different systems using different logic and arrive at the same board meeting only to present different numbers. A governed DWH with a single, authoritative definition of each metric permanently ends this dispute.
At the same time, offloading analytical pressure from production systems protects uptime and user experience. Heavy analytical queries competing for resources with live application traffic are a serious operational risk. The DWH absorbs all analytical load, leaving operational databases free to handle user-facing requests.
Enabling cross-system analysis is something no individual source system can provide. We are talking about combining CRM, marketing, support, and billing data in a single query routinely. And last but not least – supporting AI and ML pipelines. Models need large, clean, historical datasets, and the DWH is the natural home for that data.
The design and its importance
Poor DWH design is a basis for the compounding pile of problems. Every report, dashboard, ML model, and business decision built on top inherits the flaws of this foundation.
Incorrect grain is the most dangerous mistake. If a fact table’s grain is ambiguous, aggregations produce double-counted or incorrect totals. By the time the error is detected, it may have influenced months of business decisions, and fixing it requires rebuilding the entire fact table and all downstream reports.
Missing history caused by the wrong Slowly Changing Dimension strategy is irreversible. Once you’ve overwritten a value, that historical signal is gone permanently. No governance from day one turns a warehouse into a swamp: tables accumulate with unclear ownership, column names become cryptic, and analysts start building shadow copies of data they don’t trust. These problems are orders of magnitude cheaper to prevent than to fix.
Inmon, Kimball, or something different?
Bill Inmon’s top-down approach
Bill Inmon, aka the father of the data warehouse, introduced his methodology in 1990. His approach is called top-down because you start with an enterprise-wide view and work downward to individual business domains.
The centerpiece is the Corporate Information Factory (CIF). Before any analyst touches data, you build a single, fully integrated, normalized (3NF) enterprise data warehouse that serves as the authoritative record of all business data. This central warehouse is not directly queried by analysts but optimized for integration and consistency. From it, you derive data marts: smaller, subject-specific subsets designed for individual business units like finance or marketing.
The strengths of this approach include guaranteed consistency across all departments, a clean audit trail, and a model that absorbs new source systems gracefully over time. But there are also weaknesses. For starters, projects following pure Inmon methodology have historically taken 18-36 months before delivering the first analyst-facing report. That is a long time to ask stakeholders to wait. It also creates enormous political risk if business priorities shift midway through, which they always do.
Ralph Kimball’s bottom-up approach
Ralph Kimball introduced his competing methodology in The Data Warehouse Toolkit (1996), and it has arguably seen wider adoption than Inmon’s approach, particularly in organizations that need to demonstrate value quickly.
Kimball’s approach is bottom-up: identify a specific business process (retail sales, customer support, web analytics), build a dimensional model (star schema) for that process, deliver it to the business, gather feedback, then tackle the next. Over time, these models are integrated into an enterprise warehouse through the Bus Architecture, held together by conformed dimensions – dimension tables like Date and Customer that are defined identically across all data marts, allowing analysts to combine data across subject areas in a single query.
The key strengths of Kimball’s approach are speed and usability. A skilled team can deliver a first star schema in weeks. The structure is also intuitive for analysts; even those without deep SQL expertise can navigate a fact table surrounded by clearly labeled dimensions. However, if different teams create slightly different versions of the Customer dimension, the warehouse fragments into inconsistent islands that are extremely difficult to reconcile later.
Not sure which methodology fits your organization?
Our architects have designed warehouses for both approaches – let’s talk through yours.
The third option – hybrid
In practice, the Inmon vs. Kimball debate is mostly theoretical for organizations starting fresh these days. The golden mean is the modern hybrid approach that borrows the best of both and adds a third ingredient: cloud-native platform economics that make previously expensive trade-offs much cheaper.
Most mature architectures in 2026 follow the Medallion pattern: an Inmon-style integrated core in the Silver layer (normalized, governed, conformed) feeds a Kimball-style star schema consumption layer in Gold (denormalized, fast, analyst-friendly), all sitting on a cloud platform like Snowflake, BigQuery, or Databricks. Tools like dbt define all transformation logic as version-controlled SQL, making the pipeline auditable, testable, and accessible to any engineer who knows SQL, without requiring expensive proprietary ETL tooling.
From on-premise to data lakehouse
Understanding of the Medallion Architecture
The Medallion Architecture organizes data into three progressive quality tiers inside a Data Lakehouse.
Bronze (Raw): Data lands exactly as it arrived – no transformation, no cleansing. JSON stays JSON, malformed CSVs retain their original shape. Bronze is append-only and immutable, serving as an unimpeachable audit trail. If a downstream transformation introduces a bug, you reprocess from Bronze.
Silver (Refined): Bronze data is cleaned, validated, and conformed here. Duplicates are removed, nulls handled, entity names standardized, schemas enforced, and data from multiple sources integrated. This is where most data engineering work happens.
Gold (Curated): Star schemas, aggregated summary tables, and wide pre-joined tables purpose-built for specific consumers – the finance team’s revenue summary, the marketing team’s campaign performance view, the executive KPI dashboard.
The underlying enabler is an open table format, which adds a transaction log and metadata layer on top of Parquet files in object storage. This gives you ACID transactions, time travel (query the table as it existed at any past moment), schema evolution, and efficient upserts: capabilities that previously required a proprietary database engine.
What is a traditional 3-tier architecture?
The traditional on-premise DWH architecture, dominant from the 1990s through the mid-2010s, follows a three-tier pattern built around a nightly ETL pipeline.
Tier 1 (Sources) consists of all operational systems – ERPs, CRMs, point-of-sale systems, flat files, and third-party feeds. Tier 2 (Staging and integration) is where ETL happens: data is extracted from sources on a schedule, transformed in a separate ETL server (cleaning, deduplicating, conforming), and loaded into the warehouse. Tier 3 (Presentation) is where analysts interact with data: the central warehouse and a set of departmental star-schema data marts, connected to BI tools like Crystal Reports or MicroStrategy.
The fundamental constraint of this architecture is that storage and compute are tightly coupled. The warehouse server owns both the disk and the CPU. To handle more data or more users, you buy a bigger server. Scaling is expensive, slow, and coarse-grained – you can’t add compute for a quarter-end reporting surge and then scale it back down. Hardware sits idle most of the time, and ETL pipelines are brittle: a change to business logic requires rewriting the ETL job, reprocessing historical data, and reloading it from scratch.
The shift to cloud-native
The arrival of cloud-native data warehouses such as Google BigQuery (2010), Amazon Redshift (2012), and Snowflake (2014) fundamentally changed the economics of data warehousing. The key innovation was separating storage from compute.
Data lives in cheap, durable object storage (S3, GCS, Azure Blob). Compute is provisioned separately and scales independently. You can suspend it entirely when no queries are running, and spin up multiple isolated compute clusters for different workloads simultaneously. Snowflake pioneered the multi-cluster shared data model: a single copy of data can be queried simultaneously by independent clusters for engineering, BI, and data science without any workload affecting the others. BigQuery went further with a fully serverless model: no clusters to manage at all, with infinite auto-scaling and per-terabyte billing.
This shift also enabled ELT over ETL: because the cloud warehouse engine is powerful enough to transform data at scale, and because object storage is cheap enough to hold raw data indefinitely, you can load first and transform inside the warehouse using SQL, eliminating separate ETL servers and making transformation logic accessible to any SQL-literate engineer.
Advanced data modeling techniques
Dimensional modeling
Dimensional modeling is the dominant approach for designing the Gold consumption layer, and mastering it requires understanding several concepts beyond just fact tables and dimension tables.
Fact table types vary by business process. A transaction fact table has one row per discrete event – one row per sale, per click, per ticket opened. This is the most common and most granular type. An accumulating snapshot fact table tracks the lifecycle of a process: one row per order that gets updated as the order moves through stages (placed – shipped – delivered – returned), with date keys for each milestone. A periodic snapshot fact table captures the state at regular intervals: one row per account per day showing balance, one row per product per week showing inventory level.
Grain declaration is the single most important decision in dimensional modeling. Grain defines what one row in the fact table represents (one row per sales transaction line item, for example). Every fact column and every foreign key must be consistent with the declared grain. Violating grain – mixing daily snapshots with individual transactions in the same table – produces incorrect aggregations and confuses every analyst downstream.
Slowly Changing Dimensions (SCDs) address one of the most practically important problems in warehousing: what happens when a dimension attribute changes? If a customer moves cities, do their historical orders suddenly appear to come from the new city? SCD Type 1 overwrites the old value, which is simple, but loses all history. SCD Type 2 inserts a new row with effective date ranges, preserving full history, and this is the most widely used approach and the most powerful for historical analysis. SCD Type 3 adds a “previous value” column to the same row – a compromise that tracks only one prior state.
Schemas: Understanding and comparison
The Star schema wins on query speed and analyst usability, joining the fact table to any dimension is always a single join. The Snowflake schema normalizes dimensions into sub-dimensions, saving storage but adding join complexity. The Normalized (3NF) schema eliminates all redundancy but requires many chained joins to answer even simple business questions – it belongs in the integration layer, not the consumption layer.
Data Vault 2.0
Data Vault 2.0 is a modeling methodology specifically engineered for the enterprise integration challenge: how do you build a warehouse that absorbs schema changes, new source systems, and new business requirements without a full rebuild?
The three structural components are:
- Hubs – representing core business concepts identified by their natural business keys (customer IDs, product codes). Hubs are immutable; once a business key is loaded, it never changes.
- Links – representing relationships between hubs, capturing the fact that an order was placed by a customer, for example. Like hubs, links are insert-only.
- Satellites – storing all descriptive attributes and tracking their change history over time, with a new row inserted whenever any attribute changes.
Data Vault excels at auditability and flexibility: you can add a new source system by adding new satellite records without touching existing tables, and every insert is timestamped and source-attributed. The area to be careful about is query complexity. Querying Data Vault directly requires joining hubs, links, and satellites in patterns that are unintuitive for analysts.
For this reason, Data Vault is almost always used as the Silver integration layer, with Gold star schemas built on top for consumption.
Designing and implementation: Step-by-step guide
Requirement gathering
Requirements gathering for a DWH is fundamentally different from gathering requirements for an application. You are not building features; you are building infrastructure for decisions.
The questions are: What decisions do we make, and what information do we currently lack to make them with a complete confidence?
Work with stakeholders to identify the core business processes that generate data and drive decisions: sales order management, inventory tracking, customer service interactions, and campaign performance. Each process is a candidate for a fact table. Capture metric definitions with precision and get formal sign-off – a term “revenue” has different meanings to sales (booked), finance (recognized), and operations (shipped).
Capture freshness requirements (does this dashboard need to be 5 minutes fresh or is daily acceptable?), historical depth (how many years back does trend analysis need to go?), and access requirements (who needs to see what, and are there regulatory constraints?). Poor requirement gathering is the root cause of most DWH failures.
Source system analysis
Before writing a single transformation, profile every source system thoroughly. The key questions are: what is the grain of each source table? How does data change – do rows update in place, or does the system append new records? What is the data quality actually like in production (not what the documentation says)? Are there missing values, duplicate keys, inconsistent date formats, or referential integrity violations?
Source system profiling typically reveals that production data is far messier than anyone admits. Columns described as “required” contain nulls. Primary keys have duplicates due to historical bugs. Date fields contain values like 9999-12-31 as a sentinel for “no date.” Catching these issues during the analysis phase is far cheaper than discovering them after the warehouse is live and reports are suddenly wrong.
Logical and physical modeling
Logical modeling defines the entities, attributes, and relationships in technology-agnostic terms. Which business processes need fact tables? What are their grains? Which dimensions are shared across processes (conformed) and which are local? What SCD type applies to each dimension attribute? This phase produces an entity-relationship diagram and a detailed data dictionary.
Physical modeling translates the logical model into platform-specific table definitions. On Snowflake, this means choosing clustering keys. On BigQuery, it means defining partition columns and cluster columns. On Redshift, it means choosing sort keys and distribution styles. Physical modeling decisions that seem minor (like choosing to partition by month instead of day, for example) can have order-of-magnitude effects on query performance and cost at scale. The physical model should be designed with the most common query patterns in mind, profiling which columns appear most frequently in WHERE clauses and GROUP BYs.
The shift from ETL to ELT
In traditional ETL (Extract, Transform, Load), data is extracted from source systems, transformed in a separate ETL server or tool (Informatica, SSIS, Talend), and only then loaded into the warehouse in a clean, ready-to-use form. The transformation layer is a heavyweight, often proprietary piece of infrastructure that requires specialist skills to maintain.
In modern ELT (Extract, Load, Transform), raw data is loaded first, directly into the warehouse or lake storage, and transformation happens inside the warehouse using its own compute engine, typically expressed as SQL managed by dbt. This is better in almost every respect: no separate ETL server to manage, transformation logic is version-controlled SQL rather than proprietary GUI-configured jobs, the raw data is preserved for reprocessing, and the same engineers who build models can write transformations without learning a new tool.
Data quality and governance
Data quality must be enforced at every layer of the pipeline. At the ingestion layer, apply null checks, range validations, and referential integrity tests as data lands in Bronze. At the transformation layer, use dbt tests (built-in schema tests and custom SQL tests) to assert that fact table keys are never null, that metric values are within expected ranges, and that row counts don’t drop unexpectedly between pipeline runs. At the consumption layer, build reconciliation checks that compare DWH totals against known-good source system totals.
Governance is the organizational complement to technical quality controls. Build a data catalog (Collibra, Alation, or open-source tools like DataHub) so users can discover what tables exist, what each column means, and who owns it. Define and enforce naming conventions – consistent, descriptive column names prevent the flag2 and temp_col entropy that makes mature warehouses unnavigable. Every dataset needs a named owner responsible for its quality and freshness. Establish a formal change management process so that schema changes to upstream source systems don’t silently break downstream models.
Security framework
Security in a DWH is multi-layered and must be designed from the start. Role-based access control (RBAC) is the foundation: define roles that map to job functions (analyst, engineer, executive) and grant permissions to roles rather than individual users. Analysts get read access to Gold layer tables. Engineers get write access to Bronze and Silver. Executives may get access to a curated subset of Gold with no PII.
Column-level security masks or tokenizes sensitive columns – PII like email addresses, phone numbers, and government IDs – for users who don’t have a business need to see them. Row-level security restricts which rows a user can see based on their attributes – a regional sales manager sees only their region’s data even when querying a global table. Audit logging records every query, every schema change, and every permission grant, creating the paper trail required for regulatory compliance in industries like financial services and healthcare.
Performance and cost optimization
Partitioning and clustering
Traditional indexes don’t exist in most cloud warehouses. Instead, performance is achieved through partitioning and clustering. Partitioning divides a table into physical segments based on a column value, most commonly a date. A query filtering on WHERE order_date >= ‘2025-01-01’ against a date-partitioned table skips every partition outside that range, scanning only the relevant data.
Without partitioning, the same query scans the entire table regardless of the date filter – an exponentially worsening problem as the table grows.
Clustering (called sort keys in Redshift, cluster keys in Snowflake) orders data within partitions by one or more columns. If analysts frequently filter or group by region and product_category, clustering on those columns means rows with the same values are co-located on disk and can be read with minimal I/O. Choosing partition and cluster columns requires understanding actual query patterns, as the wrong choice provides no benefit, and the right choice can reduce query cost by 10-100 times.
Materialized views
A materialized view pre-computes and physically stores the result of an expensive query. Instead of re-joining and re-aggregating tens of millions of rows every time a dashboard loads, the result is already computed and stored, refreshed on a defined schedule or incrementally as new data arrives.
Materialized views are most valuable for queries that are run frequently (every dashboard refresh), are expensive (involve large joins or complex aggregations), and whose results change slowly relative to how often they’re queried. A daily revenue summary materialized view, for example, can serve hundreds of dashboard loads without touching the underlying fact table at all. In Snowflake and BigQuery, materialized views can be configured to refresh automatically and incrementally, only reprocessing rows that have changed since the last refresh.
Cloud FinOps
Cloud DWH costs can spiral quickly without active management. The biggest lever is compute suspension: in Snowflake, virtual warehouses should be configured to auto-suspend after 1-5 minutes of inactivity, and auto-resume on demand. A warehouse left running overnight with no queries costs the same as one running at full capacity, suspending it when idle can cut compute costs by 60-80%.
Query optimization is the second major lever. Poorly written queries that select * instead of specific columns, that fail to filter on partition columns, or that join enormous tables without taking advantage of clustering are dramatically more expensive than well-written equivalents. Establishing a query review culture (where expensive queries are identified via cost monitoring and optimized) pays continuous dividends. Workload isolation separates heavy batch transformation jobs from live BI queries into different compute clusters, preventing batch jobs from consuming the budget that drives dashboard latency for end users.
Most cloud DWH cost problems are fixable in under a month
Let’s get your bills under control.
AI, real-time, and self-service: What to expect in the near future?
AI-ready infrastructure
Designing a DWH for AI and ML readiness requires thinking beyond the needs of today’s analysts and anticipating the needs of tomorrow’s model pipelines. The most important principle is preserving raw data: ML models often need original, un-aggregated signals (the raw event stream, the unfiltered transaction log) that are destroyed by typical analytical transformations. Keeping the Bronze layer accessible and long-retained is essential.
A feature store – either a purpose-built platform like Feast or Tecton, or a well-governed set of Gold layer tables – is the infrastructure that bridges the DWH and the ML platform. It provides pre-computed features (customer lifetime value, 30-day purchase frequency, product affinity scores) in a form that is consistent between training and inference. Without a feature store, models trained on one version of a feature are served against a slightly different version at inference time – a silent source of model degradation. Data lineage tracking (knowing exactly which source data, transformations, and business rules produced each column) is also essential for ML governance: regulators increasingly require organizations to explain which data trained which model.
Streaming DWH
Traditional DWHs are batch-oriented; data arrives hours after the fact. For use cases that require near-real-time analytics (fraud detection, live inventory management, personalization engines), streaming architectures enable sub-minute or even sub-second data freshness.
The canonical streaming pipeline runs: Kafka or Kinesis (event streaming backbone) – Flink or Spark Streaming (stateful stream processing, joins, aggregations) – Delta Lake or Iceberg (transactional storage layer that supports upserts and time travel) – Cloud DWH (for serving). The key design challenges unique to streaming are handling late-arriving data (events that arrive out of order due to network delays) and ensuring exactly-once processing semantics so that events are neither dropped nor double-counted. Most modern stream processors handle these via watermarking and transactional sinks, but they must be explicitly configured – the default behavior is usually at-least-once, which means duplicates.
Data democratization
The ultimate goal of a DWH is not to serve data engineers; it is to make data accessible to every decision-maker in the organization, regardless of their technical sophistication. Achieving this requires both technical and organizational investment.
On the technical side: semantic layers (tools like Looker’s LookML, dbt Metrics, or Cube.js) translate raw SQL tables into business-friendly concepts, so a marketing manager can build a report using “monthly active customers” without knowing which tables and joins produce that metric. Natural language interfaces and text-to-SQL tools (now increasingly powered by LLMs) allow non-technical users to ask questions in plain English and receive SQL-generated answers. Self-service BI platforms (Tableau, Power BI, Metabase) with embedded row-level security let users explore data freely within the boundaries of their access permissions.
On the organizational side, technology alone is not enough. Data literacy programs such as training business users to understand what data means, how it was produced, and what its limitations are are essential for preventing misinterpretation of self-service results. A metric on a dashboard is only valuable if the person reading it understands its definition, its freshness, and its caveats.
Is your data ready?
Your competitors are already training models on clean, governed data.
Conclusion
A well-designed data warehouse is a strategic asset, not merely a technical one. The specific tools matter far less than the architectural and modeling decisions made in the first weeks of design.
If any of the above resonated, your warehouse probably needs attention. From the first data model to the production-ready pipeline – we’ve done it for healthcare, fintech, and energy companies. You could be next. Book a call and let’s discuss where your DWH stands.
FAQ
What is the difference between a Data Warehouse and a Data Lakehouse?
How do I prepare my Data Warehouse design for AI and Machine Learning?
Keep raw data accessible in the Bronze layer – models often need original signals. Build a feature store (Feast, Tecton, or a custom Gold layer table) that serves pre-computed features consistently between training and inference. Maintain data lineage so you can trace which data trained which model. Design for low-latency reads if you need real-time inference. And ensure your governance framework covers ML model metadata, not just datasets.
Is Data Vault 2.0 better than a Star Schema?
They solve different problems. Data Vault excels at integration and auditability – it handles schema changes gracefully and maintains full history of every change. Star schemas excel at query performance and analyst usability. The best architectures use both: Data Vault in the Silver/integration layer, star schemas in the Gold/consumption layer.
How can I control costs in a Cloud Data Warehouse?
The biggest levers: auto-suspend compute clusters when idle, partition tables by date so queries scan only relevant data, use materialized views to cache expensive aggregations, enable result caching for repeated queries, and separate workloads into different compute clusters to prevent batch jobs from consuming BI query budget.
What are Slowly Changing Dimensions (SCD), and why are they important?
An SCD handles the problem of dimension attributes that change over time. If a customer moves from Warsaw to Berlin, do their past sales now appear to come from Berlin? Type 1 overwrites the old value (loses history). Type 2 adds a new row with effective date ranges, preserving full history – this is the most common and powerful approach. Choosing the wrong SCD type means your historical reports silently produce incorrect results.
How does a Star Schema improve query performance compared to a Normalized Schema?
A normalized schema requires chaining many joins to answer a simple business question. A star schema pre-joins the data – dimensions are denormalized – so a query only needs to join the fact table to one or two dimensions. Fewer joins means less CPU, less I/O, and dramatically faster results at analytical scale.
Why is the industry shifting from ETL to ELT?
Because cloud warehouses are now powerful and cheap enough to transform data in-place. ELT is faster to implement (no separate ETL server to manage), more flexible (you can re-transform the same raw data differently later), and lets tools like dbt define transformations as version-controlled SQL – treating data transformation like software engineering.
Should I choose Kimball (bottom-up) or Inmon (top-down)?
For most organizations in 2026: start Kimball. You get business value faster, stakeholders see results sooner, and you can layer in Inmon-style integration over time. Inmon makes sense if you have a large enterprise, strong data governance requirements from day one, and the budget to invest before delivering value.
You may also like
-
 April 9, 2026Read in 23 min.
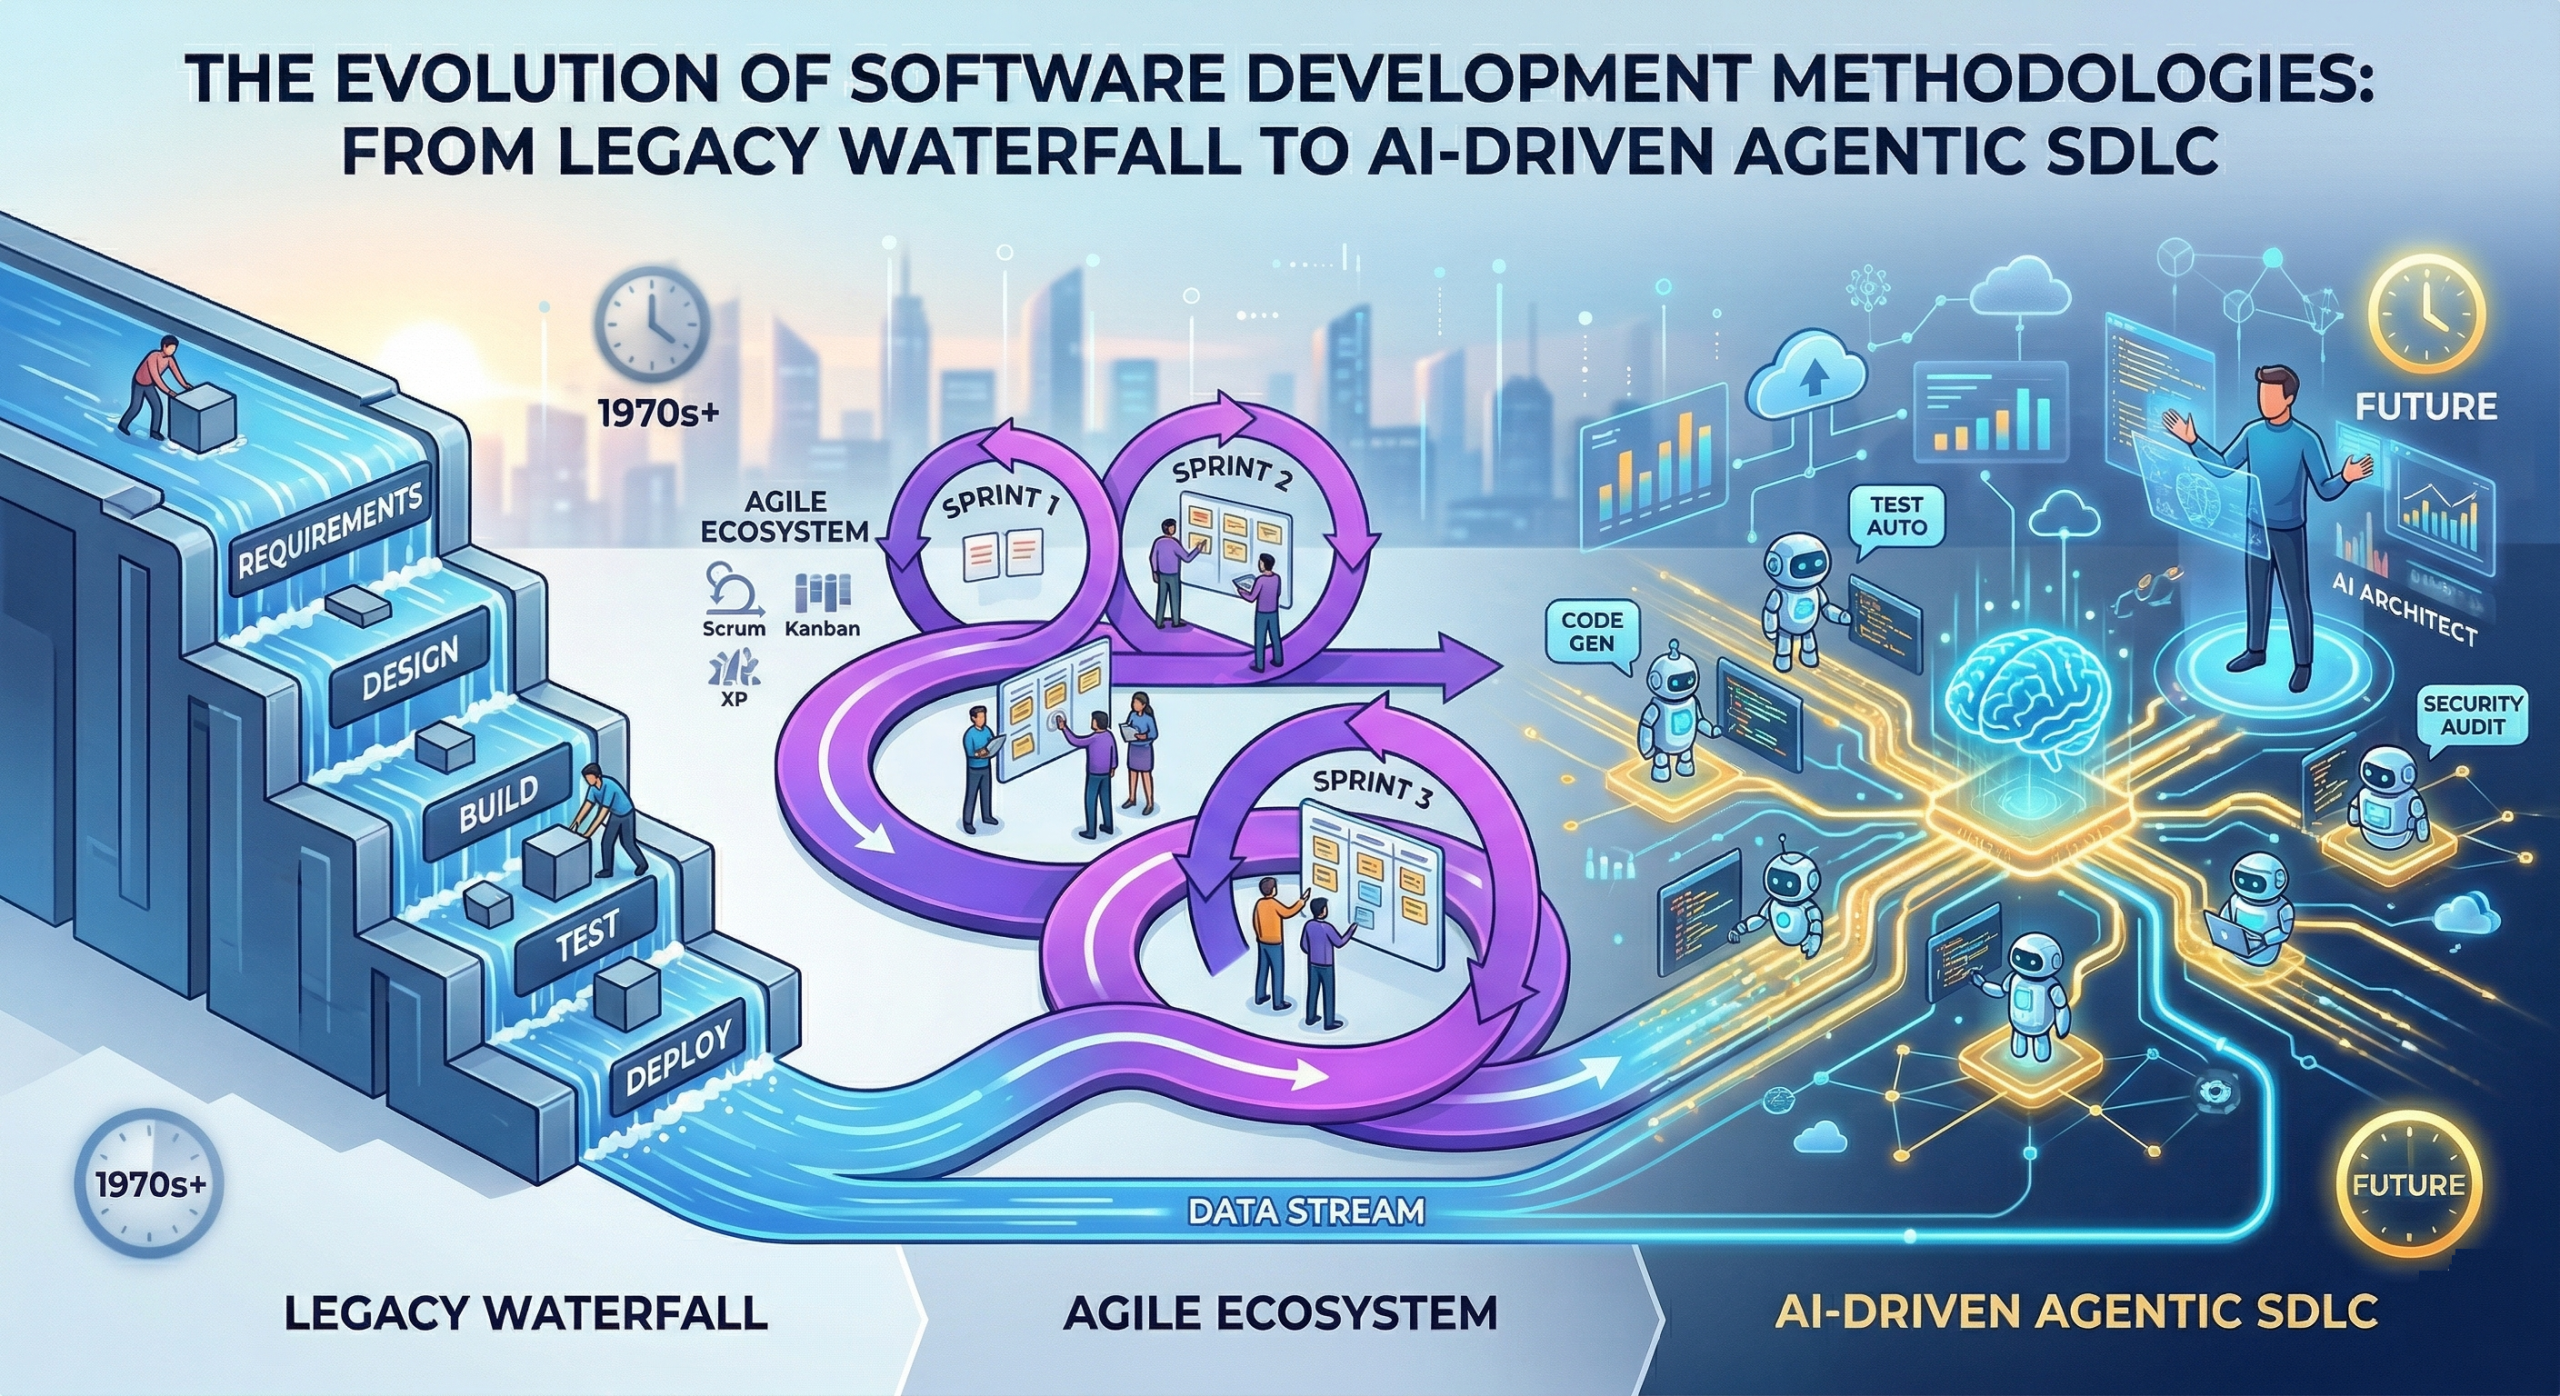
Software development methodologies: A complete guide from waterfall to AI-driven SDLC
Which methodology fits your project? Read our deep dive into Scrum, Kanban, Lean, and AI-powered development with a full comparison matrix -
 April 9, 2026Read in 10 min.
Microsoft PowerApps development services
Accelerate your digital transformation with expert PowerApps development services. We build custom, low-code mobile and web apps that integrate seamlessly with Microsoft 365, SQL, and your existing APIs. Get a free consultation today. -
 April 8, 2026Read in 12 min.
Top 10 Offshore software development companies: Expert review
Don't settle for legacy code. Discover the top offshore software development services company list, featuring vendors with advanced AI-tooling and DevOps maturity -
 April 3, 2026Read in 31 min.
AI software development services: A complete guide for business leaders and decision-makers
Transform your business with expert AI software development services. We build custom GenAI, machine learning, and autonomous agent solutions tailored for enterprise ROI. Get a free consultation today! -
 April 1, 2026Read in 17 min.
The strategic hub: Why global leaders choose software development outsourcing in Ukraine
Why global leaders choose software development outsourcing in Ukraine. Explore the top 10 IT companies, specialized tech stacks, and how to scale your business with a dedicated Ukrainian development team. -
 March 31, 2026Read in 19 min.
Selecting the best Java development companies
Leading Java development companies. Analyzes top-tier Java software development services, evaluation criteria, and delivery models to help you find the perfect strategic partner for scalable enterprise solutions -
 March 31, 2026Read in 14 min.
Top progressive web app development companies
Partner with a leading progressive web application development company. Explore our list of top PWA developers in the USA and globally, offering high-speed, offline-ready, and SEO-friendly web app solutions -
 March 18, 2026Read in 13 min.
Choosing React Native app development company
Partner with a premier react native development company. Compare the top 10 firms offering elite react native app development services for high-performance apps. -
 March 17, 2026Read in 15 min.
Choosing the Right Computer Vision Development Company for Your Project
From computer vision consulting to full-scale software development, learn how modern vision systems automate defect detection and optimize operations across healthcare, retail, and manufacturing. -
 March 16, 2026Read in 12 min.
AI in data governance: Everything technology leaders need to know
Master Data Governance for AI. Learn how to manage data drift, bias mitigation, and active metadata using NIST standards. Expert guide on MLOps, RAG security, and EU AI Act compliance for 2026. -
 March 16, 2026Read in 16 min.
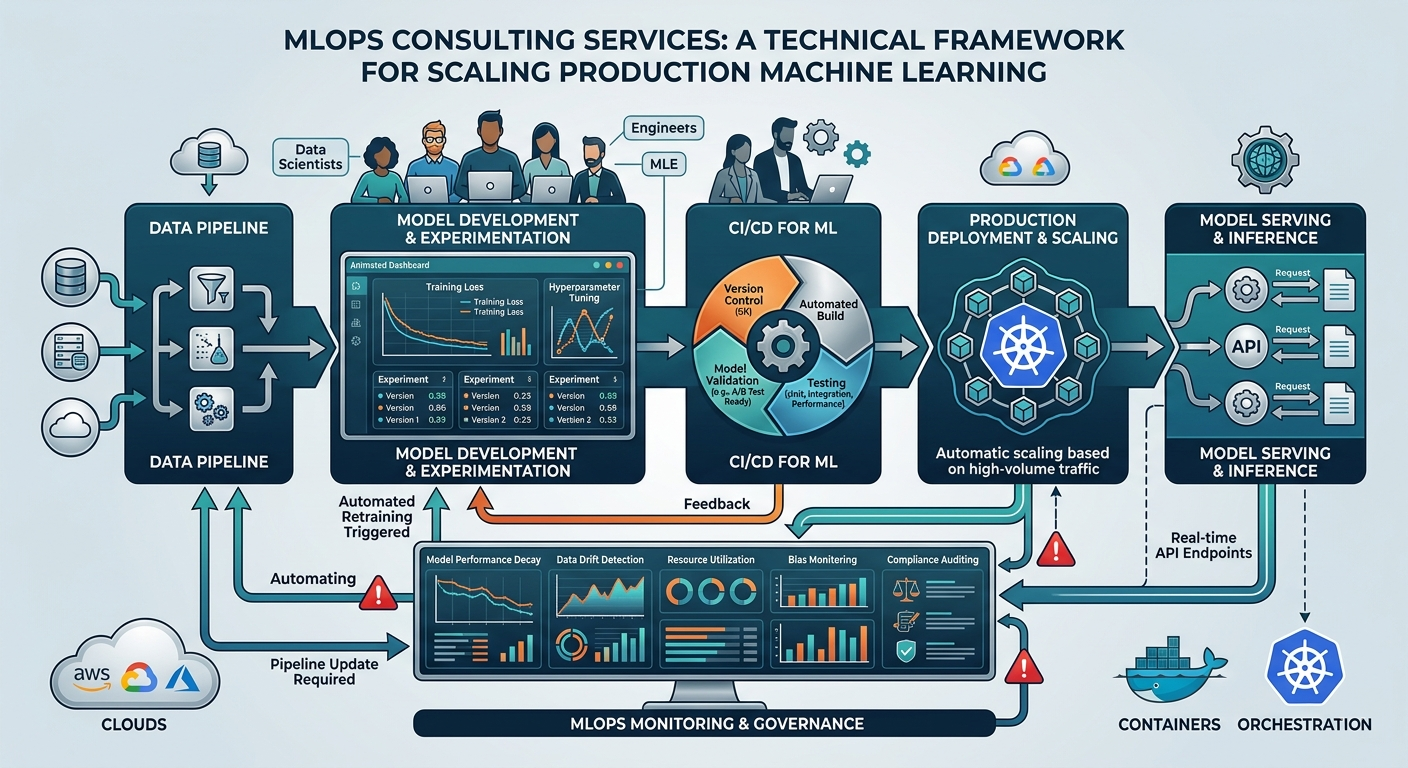
MLOps consulting services: A technical framework for scaling production machine learning
Operationalize ML with expert MLOps consulting. We bridge the gap between Data Science and DevOps using CI/CD/CT pipelines, automated drift detection, and feature stores to reduce Time-to-Value and technical debt. -
 March 12, 2026Read in 12 min.
Choosing your generative AI development company
Compare the best generative AI companies for your enterprise. From custom LLMs to agentic workflows, discover the top partners driving innovation and ROI in the AI-first era. -
 March 6, 2026Read in 15 min.
PyTorch vs TensorFlow: What’s the difference and which one wins
Stop choosing between research and production. Learn how Keras 3 and multi-backend architectures are unifying the AI ecosystem. A professional developer’s deep dive into performance, cost, and scalability. -
 March 5, 2026Read in 15 min.
Choosing the best MVP development companies
Top-rated agencies providing bespoke MVP software development services to help startups validate ideas and scale fast -
 March 4, 2026Read in 19 min.
Top software testing companies: Leading QA partners
Leading software testing companies. Compare top QA service providers, evaluation criteria, and industry trends to find your ideal partner. -
 February 28, 2026Read in 22 min.
Top 10 software development companies in the USA
Find the best US-based software developers. From AI to enterprise web apps, here are the top 10 software development companies in the USA you should hire in 2026. -
 February 25, 2026Read in 12 min.
Top 10 Node.js Development Companies
Industry's leading Node.js development companies. Our deep-dive review covers technical maturity, cloud-native expertise, and architectural standards to help you find the perfect software partner. -
 February 23, 2026Read in 16 min.
Top 10 mobile application development companies: Selection & industry leaders
Top 10 mobile application development companies for your next project. Compare top-rated mobile app developers, explore custom app development company profiles, and learn the secrets to a successful technical partnership. -
 February 23, 2026Read in 12 min.
How to choose the best Android app development agency: Rankings & selection criteria
Compare the leading Android development companies. Our guide highlights the top 10 firms for enterprise architecture, security, and custom app engineering. -
 February 19, 2026Read in 18 min.
IT Managed Service Providers (MSPs): Why does your business need one?
Stop guessing. Compare the 10 leading IT Managed Service Providers (MSPs) for any-sized companies. Find proven security, cloud, and 24/7 support. View the comparison! -
 February 19, 2026Read in 45 min.
Top 30 software development companies: Categories, red flags, and the selection strategy
We’ve analyzed the top 30 software development companies based on expertise, client results, and innovation. Find your ideal match here! -
 February 11, 2026Read in 18 min.
Top 10 Cloud migration companies: Strategic architecture of cloud migration
Compare the top 10 cloud migration companies based on architectural depth, FinOps integration, and modernization capabilities. Expert insights into AWS, Azure, and GCP transformation strategies for enterprise leaders. -
 February 10, 2026Read in 12 min.
Top 10 Flutter development companies: Entities, ecosystems, and strategic selection
Compare the world’s leading Flutter agencies. Our expert analysis covers the top 10 firms, evaluating their mastery of Dart, Skia performance, and Clean Architecture. -
 February 6, 2026Read in 19 min.
Top 10 React development companies: Architecting high-performance digital products
Top-rated React development companies for your next project. Our expert guide analyzes the best React JS web development agencies on performance, scalability, and tech standards -
 February 3, 2026Read in 24 min.
Web application development companies: How to choose the right partner
Find the right web app development company. Explore services, technologies, engagement models, and 10 expert tips for choosing your strategic development partner. -
 February 3, 2026Read in 11 min.
Top 10 Python Development Companies
Looking for a top Python development company? Compare the industry's leading Python software development agencies. Get insights on pricing, expertise, and how to hire a Python development firm that scales your business. -
 January 27, 2026Read in 15 min.
Top cloud application development companies you should follow
Best Cloud Application Development companies for your project. Compare expertise in AWS, Azure, & GCP. See client reviews, specialization, and costs for top Cloud-Native firms -
 January 23, 2026Read in 21 min.
Dedicated development team model: Definition, benefits, and nuances
Scale your product fast with a Dedicated Development Team. Compare DDT vs. outsourcing, analyze costs, and get a management blueprint for success. -
 January 21, 2026Read in 15 min.
Best energy software development companies to partnership
Top 10 energy sector software development leaders. Learn how to choose the right partner for your renewable energy software project. -
 January 19, 2026Read in 8 min.
The Low-Code Revolution in Oil & Gas: Accelerating Digital Transformation
From real-time well monitoring to automated safety permits - see how low-code applications drive operational efficiency and ESG compliance in the energy sector’s volatile market. -
 January 19, 2026Read in 18 min.
Top 10 desktop application development companies to watch
Compare the world’s best desktop development firms. From legacy modernization to high-performance C++ and cross-platform Electron apps, find your perfect vendor here. -
 December 24, 2025Read in 10 min.
Software development company in Florida: What we do, how we work, and where we add value
Florida's premier custom software partner for enterprise-grade applications. We specialize in fintech, healthcare, and scalable cloud systems. Innovate with Florida experts. -
 December 9, 2025Read in 10 min.
Custom software development for San Diego businesses
Find out about the demands of software development in San Diego and how local companies are adapting to technology needs. -
 December 9, 2025Read in 9 min.
Specifics and perspectives of custom software development in Los Angeles
Find out why choosing a custom software development company in Los Angeles is essential for evolving industries like fintech and healthcare. -
 December 6, 2025Read in 8 min.
Software development in San Francisco: Custom solutions for Area
Find out how software development in San Francisco sets standards in technology and customer satisfaction. -
 November 28, 2025Read in 14 min.
Custom software development in Houston: State and perspectives
Partner with a leading custom software development company in Houston to harness the power of technology for your growth. -
 November 28, 2025Read in 12 min.
Custom software development Dallas businesses need
Find out how a custom software development company in Dallas can elevate your business in a booming tech landscape filled with opportunities. -
 November 27, 2025Read in 11 min.
Software development services in Austin
Find out how a custom software development company in Austin can elevate your business in a booming tech landscape filled with opportunities. -
 November 12, 2025Read in 34 min.
Top FinTech software development companies: The core of modern finance
Compare the top-rated FinTech software developers based on expertise in AI, Blockchain, and compliance. Choose your perfect partner now! -
 November 4, 2025Read in 12 min.
AI in biotech: Application, specifics, and challenges
How AI and Machine Learning are transforming biotechnology, accelerating drug discovery, genome sequencing, and personalized medicine. Learn the applications, challenges, and future. -
 October 28, 2025Read in 20 min.
The best AI development companies in the US
The definitive guide to hiring the best AI development company. See our ranking by MLOps maturity, GenAI expertise, and verified client ROI. Get transparent costs and a partnership blueprint -
 October 20, 2025Read in 16 min.
How to hire the best ReactJS developers in a constantly growing market
Hire the top ReactJS developers. Get pre-vetted, senior React & Next.js engineers matched to your project in 48 hours. Start risk-free -
 October 16, 2025Read in 25 min.
Top 10 AI chatbot development companies
Leading chatbot development companies. Our expert guide helps you choose the best firm for AI chatbot solutions, custom development, and seamless integration -
 October 9, 2025Read in 17 min.
Top biotech software companies: Choosing the right tech partner for life-changing innovations
Leading biotech software companies impacting drug discovery, R&D, and lab operations. See how their innovative platforms are speeding up scientific breakthroughs. -
 September 30, 2025Read in 16 min.
All you need to know about custom software development for small business
Stop wasting time on workarounds! Discover how custom software development empowers your small business with tailored workflows, maximum efficiency, and predictable ROI. -
 September 4, 2025Read in 14 min.
Top 10 leading application modernization companies
Top 10 application modernization companies that can transform your business with cloud, AI, and microservices for agility and growth -
 August 28, 2025Read in 14 min.
Develop once, run everywhere: .NET Core cross-platform development
Struggling with multi-OS development? Discover how .NET empowers you to build versatile, high-performance applications that run seamlessly across Windows, macOS, and Linux with ease. -
 August 21, 2025Read in 14 min.
Why offshore .NET development is the best choice for your business
Struggling with talent shortages or escalating development costs? Explores how embracing offshore .NET development can be the strategic advantage your business needs to build innovative solutions faster and more cost-effectively. -
 August 18, 2025Read in 14 min.
.NET vs Java: Comparison, use cases, pros and cons
Unsure whether to use .NET or Java? This guide breaks down their strengths, weaknesses, and ideal applications to help you pick the best technology. -
 August 11, 2025Read in 24 min.
Top 10 Angular development companies to keep an eye on
Leading Angular development companies. Expert Angular developers offering top-tier web application development, consulting, and solutions for your next project. -
 August 7, 2025Read in 15 min.
Hire Angular developers: What you need to know
Need hire Angular developers? Get access to skilled, dedicated Angular teams for your web projects. We provide expert Angular solutions with flexible engagement models. Contact us today! -
 August 1, 2025Read in 9 min.
Why choose Angular for web development
Why Angular is a leading choice for web development. Learn about its powerful features, scalability, and benefits for building robust, high-performance applications. -
 August 1, 2025Read in 12 min.
Hiring .NET developers: Step-by-step guide
Frustrated with the challenges of hiring skilled .NET developers? This article provides a proven framework to help you find, vet, and hire the right talent for your team, avoiding common recruiting mistakes. -
 February 13, 2025Read in 15 min.
What is HMI development, and why is it trending now?
Human-Machine Interface (HMI) development is revolutionizing the way humans interact with machines, driving innovation across industries. -
 December 11, 2024Read in 10 min.
Python vs Java: Key differences, pros, and cons for developers
Key differences between Python and Java, including syntax, performance, and use cases. Find out which language suits your project best -
 October 10, 2024Read in 11 min.
The future of web development: WordPress vs React.js?
Confused between WordPress or React.js? Explore our detailed comparison to find out which platform suits your needs best -
 August 8, 2024Read in 14 min.
AD and Azure AD: What is the difference, and which is better for you?
Differences between Azure Active Directory (AAD) and traditional Active Directory (AD) in this comprehensive comparison. -
 August 5, 2024Read in 15 min.
ESG software development services: Effective ESG software solutions
Innovative ESG software solutions can help your business achieve its sustainability goals. Develop customized software that enhances environmental, social, and governance (ESG) performance, ensuring compliance and driving positive impact -
 July 31, 2024Read in 7 min.
Benefits of Azure Active Directory
Key benefits of Azure Active Directory(AD), including enhanced security, simplified management, and cost savings for your business -
 April 22, 2024Read in 12 min.
Software modernization: What is it & why it matters
Discover the essence of software modernization and its pivotal role in contemporary software development. Uncover why it's crucial. -
 April 22, 2024Read in 20 min.
Legacy app modernization: A comprehensive guide
Revitalize your business with our guide on legacy application modernization. Transform your legacy systems to make them more efficient and innovative. -
 April 22, 2024Read in 16 min.
Digital product design: What is it and why you need it
Unlock innovation with expert digital product design insights. Explore the latest trends and strategies for creating exceptional user experiences. -
 April 21, 2024Read in 11 min.
Healthcare product design: Tips for app development success
Explore the art of healthcare product design in our latest blog post. Discover how innovative design principles are shaping the future of medical solutions -
 April 18, 2024Read in 9 min.
Azure app modernization: Benefits of migrating to Microsoft
Key benefits of Azure app modernization and how migrating to Microsoft can enhance performance, scalability, and compliance -
 March 11, 2024Read in 12 min.
How to choose asset management software for oil and gas in 2026
Explore more ways to optimize operations and streamline processes in oil and gas. Follow our tips to choose the best-fit assent management software in 2026 -
 March 11, 2024Read in 13 min.
AI software development for oil and gas: A comprehensive guide
Explore the transformative power of artificial intelligence software development for oil and gas and the practices of global industry leaders in our blog. -
 March 11, 2024Read in 19 min.
Cloud application modernization: How to improve your app
Cloud application modernization makes app more competitive and business more profitable. The key strategies, tips, and its benefits — in this article! -
 March 11, 2024Read in 12 min.
Enterprise application modernization: Revolutionize your business
Future-proof your business with our guide to enterprise app modernization. Learn strategic approaches, key technologies, and best practices for legacy system transformation and enhanced agility -
 March 11, 2024Read in 12 min.
LIMS integration: Benefits & how it works
Can LIMS integration be called a CRM for laboratories? What to keep in mind during LIMS software development and integration? Find out more in our article. -
 March 11, 2024Read in 11 min.
Active directory integration: What is it & how to do it effectively
Discover seamless Active Directory integration strategies in our latest blog post. Optimize user management with the Blackthorn Vision team! -
 March 5, 2024Read in 15 min.
Mobile app UX design: Basics that will improve user experience
Mobile app UX design differs from the web. Explore these differences, the process, and the main pitfalls with our experts in this article. -
 March 5, 2024Read in 11 min.
HIPAA compliance checklist for healthcare software development 2026
Check the updated HIPAA security guidelines to ensure the safety and privacy of patients' data, it is important to adhere it when creating applications -
 March 5, 2024Read in 9 min.
How to use business process automation to improve oil and gas production
Discover how business process automation can help optimize oil and gas production and improve your bottom line. -
 March 3, 2024Read in 14 min.
Desktop to web migration: everything you need to know
Planning a desktop to web migration? Get essential insights on strategy, technical challenges, approaches, and how to successfully modernize your legacy application. -
 March 3, 2024Read in 11 min.
The process of application migration to the cloud: stages, approaches, and tools
Find out how to effectively migrate your legacy system and data to the cloud without disrupting your business processes. -
 March 3, 2024Read in 16 min.
Benefits of outsourcing software development
Key advantages of outsourcing software development for businesses. Learn how outsourcing can reduce costs, increase efficiency, and provide access to specialized expertise -
 March 3, 2024Read in 13 min.
Boosting cloud security in healthcare with Azure Cloud Services
Explore the most common challenges in the cloud security of healthcare organizations and discover our tips on eliminating them efficiently. -
 March 3, 2024Read in 19 min.
Healthcare app design: how to create a great user experience
Struggling with medical app UX? Get insights into user-centered design, crucial security measures, and future trends to create impactful healthcare applications. -
 March 3, 2024Read in 16 min.
MVP vs. prototype in startup software development: what’s the difference?
Crucial differences between MVP and Prototype in startup software development. Learn how Blackthorn Vision leverages both to build successful products, reduce risk, and accelerate your time-to-market -
 March 3, 2024Read in 12 min.
How to build a custom EHR solution: tips for decision makers
We can augment your talent pool with dedicated developers proficient in healthcare business automation. Check the success stories from our clients. -
 March 3, 2024Read in 7 min.
What is software as a medical device and why it matters for the healthcare industry
From developing SaMD and SiMD to building efficient EHR systems, we unleash the value of business process automation for healthcare providers. -
 March 3, 2024Read in 6 min.
An overview of medical biotechnology in 2026 and beyond
We offer a full cycle of software development for leading biotech companies - from idea visualization to building an MVP and fully-fledged product. -
 March 3, 2024Read in 9 min.
Smart farming: agricultural technology of the future
We have expertise in data analytics, AI, and Machine Learning to build game-changing software tailored for your agricultural business. -
 March 3, 2024Read in 7 min.
BV people: a talk with Head of HR and recruitment in Blackthorn Vision
BV people: a talk with the Head of HR and Recruitment on candidate selection, the company's ideals, and the current state of the Ukrainian IT industry. -
 March 3, 2024Read in 9 min.
What is robotic process automation and how it changes the travel and hospitality industry
How does RPA work and, most importantly, how to utilize it in your travel and hospitality business? Find out in our new article now. -
 March 3, 2024Read in 12 min.
An overview of agricultural biotechnology in 2026
We cooperated with agricultural biotechnology industry leaders to design software that helps scientists and farmers automate and optimize all processes. -
 March 3, 2024Read in 10 min.
Everything you need to know about Microsoft Azure: benefits, use cases, applications
Microsoft Azure is a leading cloud service provider that offers numerous opportunities for businesses to optimize and secure their operations and services. -
 March 3, 2024Read in 10 min.
Smart manufacturing technology and trends for 2026 and beyond
Stay updated on the latest manufacturing technology trends, that drives innovation, efficiency, and growth in the industry to boost your project. -
 March 3, 2024Read in 8 min.
How to choose and manage your dedicated development team
While there are many benefits of working with dedicated software development teams, it’s not a universal solution. Discover why it is so. -
 March 3, 2024Read in 8 min.
What is the best cloud deployment model? Types of cloud computing that will benefit your business
With the guidance of our post, you can better understand various cloud computing deployment strategies. Examine cloud solutions for your company's needs. -
 March 3, 2024Read in 10 min.
Offshore vs. Nearshore outsourcing: what’s best for your business?
What is the difference between the three outsourcing types, and which one is better for your business? Please read our article to find out! -
 March 3, 2024Read in 14 min.
How to develop a medical app for doctors: everything you need to know
The mobile health industry is one of the most rapidly growing segments worldwide. Learn more about the mHealth industry in our new article. -
 March 3, 2024Read in 14 min.
Business analyst: a leading player in your software development team
Your guide to the Business Analyst's vital role in software development teams, including Agile practices, key responsibilities, techniques, and delivering real business value. -
 March 3, 2024Read in 9 min.
Hyperautomation – the future of business processes
Now business processes - Hyperautomation are increasingly not following stable and predictable scenarios. It creates a need for a new type of automation. -
 March 3, 2024Read in 6 min.
The future of Oil and Gas: industry trends and software solutions
Keep up to date on the most recent oil and gas the industry trends, which are driving modifications in technology, sustainability, and energy exploration. -
 March 3, 2024Read in 6 min.
What is an MVP, and why is it necessary? Minimum viable product examples
Even if you have just a basic vision of what your app should do, we will develop a presentable product that you can pitch to investors. -
 March 3, 2024Read in 14 min.
Top 5 soft skills to work in it successfully and resources to develop them
Are soft skills the new hard skills? Can you make a successful career in IT if you are not an effective communicator or lack creativity? -
 March 3, 2024Read in 5 min.
Mobile app development: Xamarin.Forms — a cross-platform solution that responds to modern challenges
When it comes to mobile development, there is a wide variety of solutions. Xamarin.Forms is a cross-platform solution that responds to modern challenges. -
 February 27, 2024Read in 8 min.
Top 10 programming languages of the future for web and mobile app development
Let’s have a look at the most popular programming languages that may become your business workhorse. -
 February 6, 2024Read in 16 min.
Pharmaceutical software development: Unleashing pharma innovation
Explore the future of pharmaceutical software development: innovative solutions revolutionizing healthcare efficiency & precision.