AI-powered laboratory data analysis platform for cell line research
Industry
Biotech
Location
USA
Platform
Desktop, Web
Cooperation
4+ years
About the project
A desktop application that gives research teams full control over data produced by optofluidic laboratory systems. It automatically groups experimental outputs, runs computer vision on microscopy image sequences, builds charts from filtered measurements, and exports the results as PDF reports. The app replaces the manual file-handling and one-off scripting that used to surround every experiment.
The client develops optofluidic platforms used in advanced cell line research, where individual cells are isolated, cultured, and assayed inside pen chambers. As research activity scaled, they needed a more efficient way to process growing volumes of laboratory data. At the same time, it was vital to preserve scientific accuracy.
The work Blackthorn Vision took on was the analysis layer above the instruments – turning raw output into reports that biologists can quickly read, filter, compare, and act on.
Challenge
A single run on an optofluidic platform produces gigabytes of output. That includes high-resolution images of cells captured at every step of an experiment, alongside measurements exported as CSV and XML. The data is rich, but it arrives as thousands of loose files with no analysis layer over them.
Before this project, it was a job for biologists. They manually navigated experiment outputs, processed microscopy image sequences one by one, wrote custom scripts for repetitive analyses, organized results by hand, compared results across runs, and assembled reports manually.
Every new analysis started from scratch, and these processes grew harder to scale as experiments increased in number and complexity. The client needed one application that could:
- Identify the relevant files and image sequences from a session automatically
- Let users build filters once and then reuse and share them
- Open and compare several experiments at the same time
- Generate charts that allow drilling down into the underlying data
- Export processed results into PDF reports for review and sharing
- Move through very large datasets without freezing
On top of that, it had to efficiently process gigabytes of data while staying responsive on the standard workstations that labs already use, be configurable for different experiment types, and support plugins so the client’s own team could extend it without waiting on core changes.
Why the client chose Blackthorn Vision
The decision-making factors for our client were our experience with scientific workflows and our deep expertise in Microsoft and .NET. We had also already built complex desktop applications and could combine custom software development with computer vision.
Just as important, the client wanted a flexible team able to keep pace with an R&D environment and constantly changing requirements. That fit is what turned this project into an engagement that has run for years.
Solution
Blackthorn Vision delivered a WPF desktop application that takes over the analysis work biologists were doing by hand.
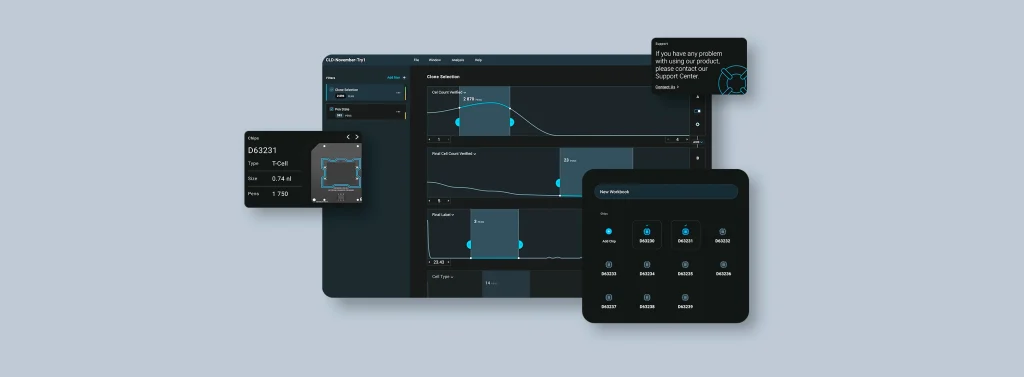
When experimental data lands, the application identifies and groups the outputs across sessions, so a researcher reaches the right dataset and image sequence without sorting files first. From there, the analysis happens through the interface.
A filter and graph builder lets scientists define which measurements to include, how to chart them, and what to compare, once, and then apply these definitions across runs or hand it to a colleague. Filters are saved objects – reusable and shareable.
On the image side, OpenCV handles enhancement and isolation automatically. The application crops to the regions that matter in a microscopy frame and corrects brightness and contrast, so cells in a pen chamber are legible without manual adjustment. Across a long image sequence, that functionality removes a step that previously had to be repeated frame by frame.
When the analysis is complete, the results – summaries, charts, and images – are exported to a structured PDF, which standardizes how teams share findings and eliminates manual report assembly.
Features
- Custom filters and graph builder allow defining complex analysis workflows through the UI, with the ability to reuse and share them across experiments
- Computer vision processing automatically isolates relevant image areas and corrects brightness and contrast across microscopy sequences
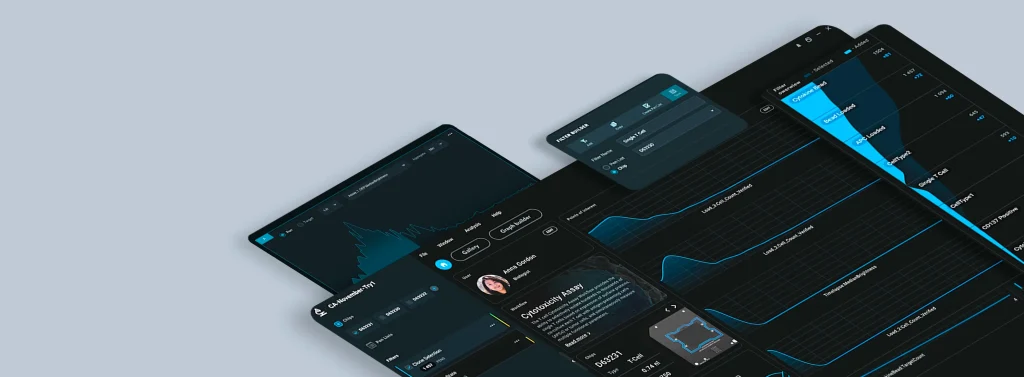
- Multi-experiment analysis for opening and comparing several experiments side by side
- Drill-down charts allow generating graphs that let researchers move from a trend down into the underlying values
- PDF report export for packaged summaries, charts, and processed images into a consistent report
- Plugin support allows adding analysis modules and capabilities without rebuilding the core application
- Configurable UI that allows adjusting layouts, templates, and views to suit a given lab or experiment type
- Data import templates for standardizing and automating how data is brought in, matched to each lab’s workflow
Development approach
The application had to load thousands of files and high-resolution image sequences while staying usable on the laptops and workstations labs actually run, not on dedicated servers.
Our team built data loading and image handling to run asynchronously and in chunks, so the interface stays responsive while large datasets are read in the background. We also tuned memory use and the rendering pipeline so that opening a big experiment doesn’t stall the application.
To ensure image processing and data handling are precise and consistent, and the same input produces the same output, we worked directly with the client’s biologists. We aimed to align the software with how experiments are actually run, so the filtering, enhancement, and measurement logic reflect real lab practice.
Understanding that research workflows change, we built the application on a plugin architecture. New analysis modules slot in without modifying the core, allowing the client to extend the platform as their work evolves rather than commissioning a rebuild each time requirements shift.
This way, we helped our client to reduce long-term development costs and keep the same foundation viable over the years.
Technologies


WPF


C#


Prism


Telerik


OpenCV
Business value
With the application we built, researchers now analyze data exported from optofluidic platforms such as BEACON and THE LIGHTNING™ in minutes rather than hours. Automated workflows cut experiment analysis time by up to 70%.
The manual processing and report assembly that used to sit between an experiment and its results is largely gone. The administrative overhead decreased, while output consistency across the team increased.
Scientists now spend more time on biological research and interpretation rather than on file management. Multi-experiment comparison and drill-down charts shortened the loop between running a session and acting on it, so decisions about where to take a line of research happen faster.
Several years in, the same foundation still anchors the client’s analysis work, which is the clearest evidence that the early architectural choices held up.
“Their professionalism distinguishes them. Blackthorn Vision’s teammates are good listeners and good workers.”
VP of software on the client side